2018 RECAP Santa Barbara Real Estate Market
2018 Real Estate Prices
This article first appeared in the Santa Barbara News-Press and Voice in February, 2019.
It was a little over a year ago that our Santa Barbara communities were beginning to come to terms with the extent of the human toll and property damage from the double tragedies of the Thomas Fire and the debris flow. When I wrote about the year-end analysis last year, we didn’t know how these events, the resulting red-zone map, and the possibility of more evacuations would affect the real estate market in those areas and the South County as a whole. With a year’s perspective, we can see more clearly. The bottom line: Santa Barbara is resilient!
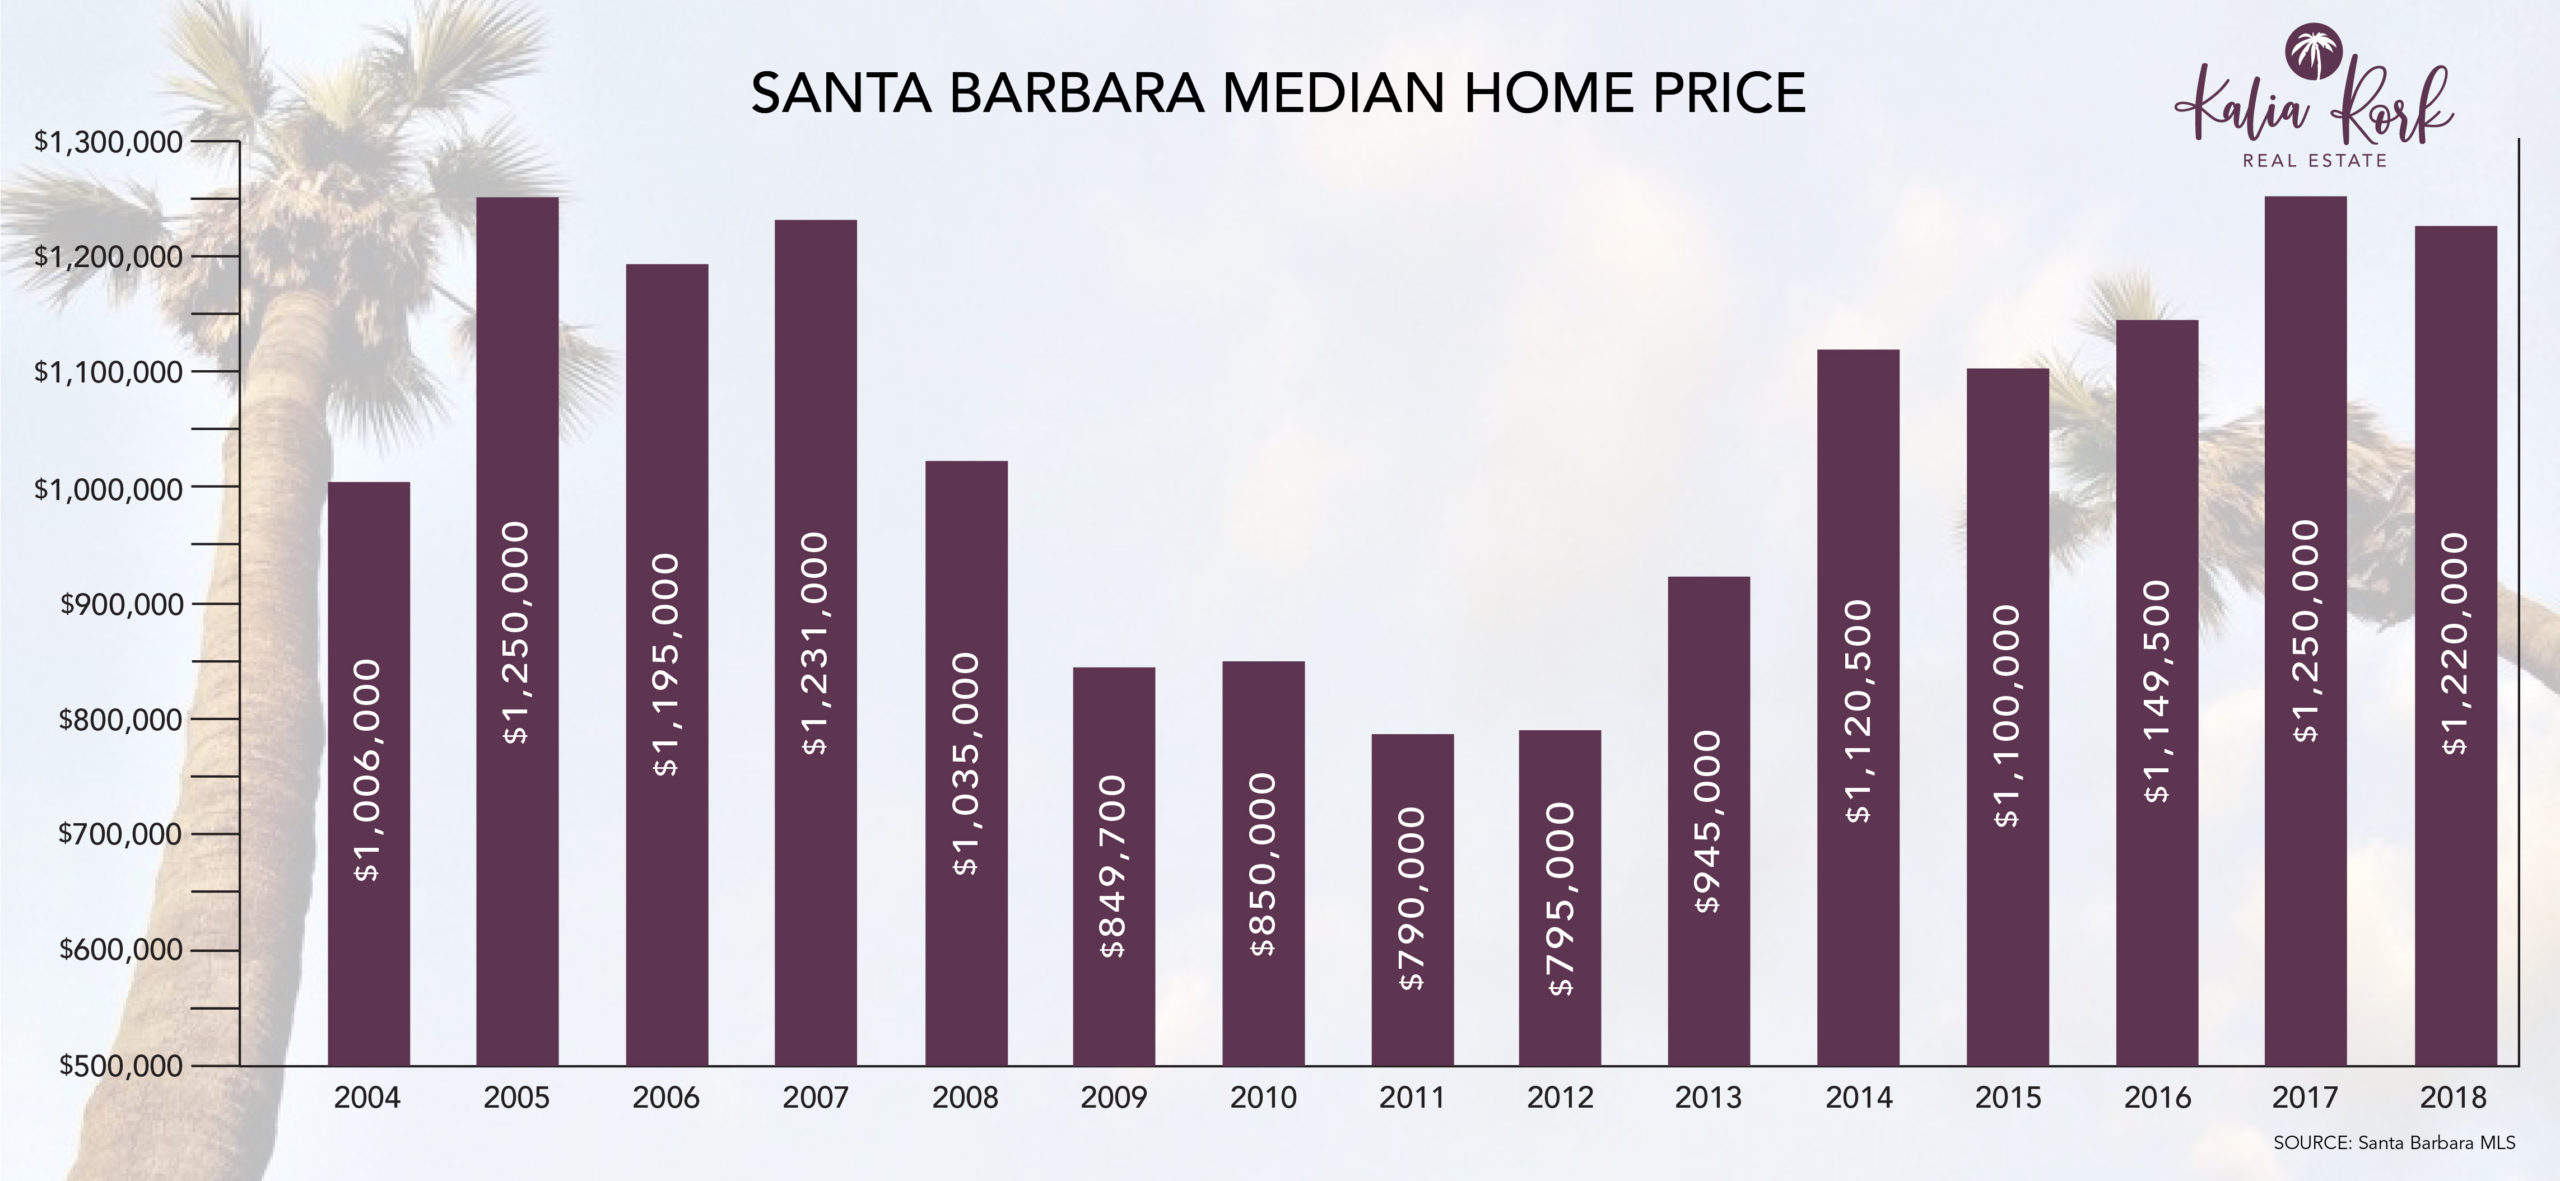
The median selling price for all houses in the South Coast market (Goleta to Carpinteria) at year-end 2018 was $1,220,000. This is a slight 2.4% drop from 2017’s median of $1,250,000. While it is true that the 2018 overall median home price declined slightly for the South Coast compared to 2017, it is important to note that all areas had highermedian price values in 2018 except Montecito. Let’s look at each of our market districts.
Table 1: Median Sales Price by District
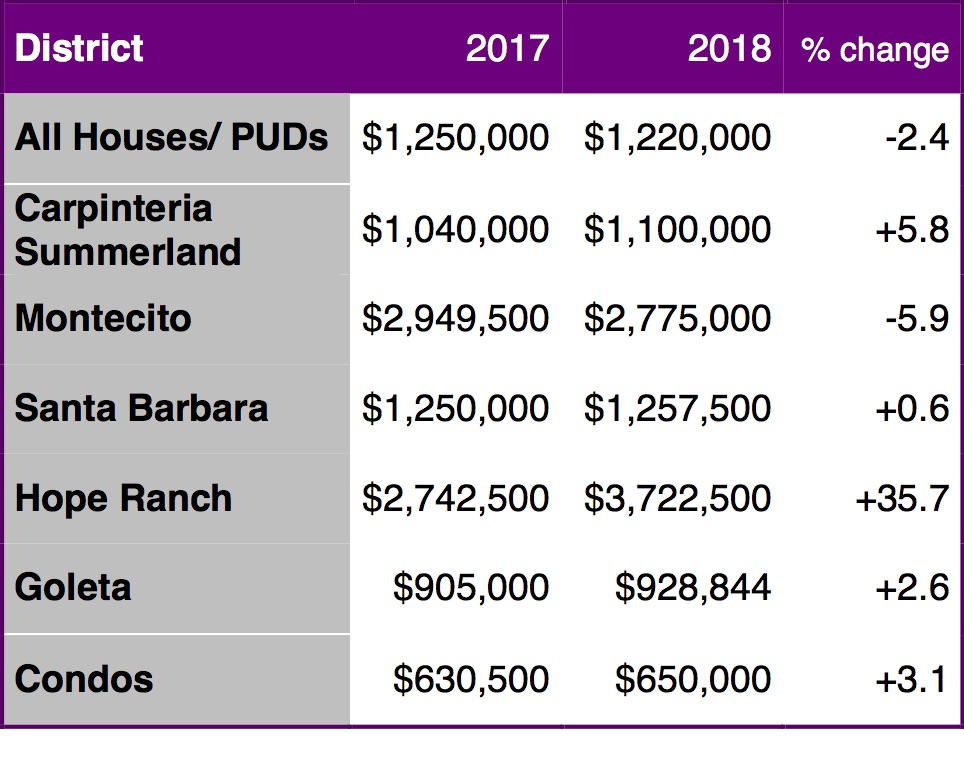
TABLE 1: Median price by district
Montecito and the market as a whole
The Thomas Fire and January 9, 2018 debris flow were major factors in Montecito’s median sales price decreasing by 5.9% in 2018, and this was enough to skew the data for the entire South Coast into negative territory. Fifty fewer homes sold in Montecito in ’18 compared to the year before (127 vs 177 sales), which is a 28% decrease. Because median price reflects the mix of homes sold as well as appreciation/depreciation, when fewer homes sell in our largest luxury market, the median price for all houses will decline.
We enlisted the help of a local math teacher, and he calculated that if 38 more homes sold that were priced over the 2017 median, then we would nothave seen the overall median price decline in ’18. Because the number of sales in Montecito has been around 170 for the past three years, it’s easy to conclude that those 50 fewer Montecito sales were a significant factor in bringing down 2018’s overall median price. Of course we will never know what the Montecito market may have experienced in 2018 without the fire and debris flow, but this does illustrate that our market as a whole was fairly stable last year.
Santa Barbara
Most of our market segments saw price increases from approximately 1/2% to 3% last year, with our largest district (Santa Barbara East and West of State Street) showing a 0.6% increase. Santa Barbara represents 51% of total South County sales — and is a good indicator of how the rest of the local real estate market performed in 2018. The 552 total sales in 2018 in Santa Barbara is relatively consistent with prior years, down by just 2.8%.
Hope Ranch
Median selling price in Hope Ranch increased significantly in 2018, but because this is a small market segment, that number can be misleading. There were 12.5% more sales in Hope Ranch in 2018 compared to the year before, but that represents just 4 more sales (36 in 2018 compared to 32 in 2017). An average year in the Ranch has about 30 sales. Some homeowners who were displaced because of the debris flow did buy homes in Hope Ranch as well as in Goleta and Santa Barbara, but many have chosen to stay in Montecito and rebuild.
Carpinteria/Summerland
These seaside towns saw a decrease in the number of sales from 2017, but the 83 closings in 2018 were within this district’s normal range. The prior year was the outlier with a higher volume of sales. Despite also being impacted by the fire and debris flow, Carpinteria’s median sales price increased by nearly 6% in 2018. This is a small segment, too, and a few more sales at the high end can skew this number, but we are definitely seeing price appreciation in Carpinteria area houses over the past two years. It’s still a seller’s market in much of Carpinteria with just 2.7 months of inventory.
Goleta
The number of Goleta sales were down by almost 7% in 2018, compared to 2017, and some of this is due to lack of inventory. (See below for more about housing inventory). We’re still seeing multiple bidders for competitively priced Goleta homes, but not as many as the year before. With just 3.5 months of inventory, this district is on the cusp between a seller’s market and a balanced market. A low supply can put upward pressure on prices, and we saw the Goleta median increase by 2.6% in 2018 to $928,844.
Condos
Just four more condos sold in 2018 than the year before on our MLS. This statistic doesn’t include some of the sales of brand new condos, but does show that condo sales are remaining consistent.Condominium selling prices continued to inch up, coming in at $650,000. Some of this increase is attributable to the new luxury condo sales bringing up the median price.
How Many Homes for Sale?
In 2018, we had a total of 1,084 houses and PUDs close escrow on the South Coast. That’s down 8% from 2017’s 1,179 closings. Half of that decline is most likely attributable to fewer sales in Montecito, and some is due to low inventory, especially in Goleta. We use “months of inventory” to measure how dynamic the market is. This is the amount of months it would take for all listings to sell if no new homes hit the market. Less than three months is considered a strong seller’s market (not as many homes for buyers to choose from), and over 6 months is considered a buyer’s market (more inventory of homes). The South Coast’s overall supply of homes hovered around 3 months of inventory for several years, and that number has inched up to 5 months at the end of 2018. This is considered a balanced market, favoring neither buyers nor sellers, and can lead to stability in prices as well as volume of sales.
(See Table 2 for comparison of number of sales by district and Table 3 for the months of inventory by market segment.)
Table 2: 2018 Number of Sales by District
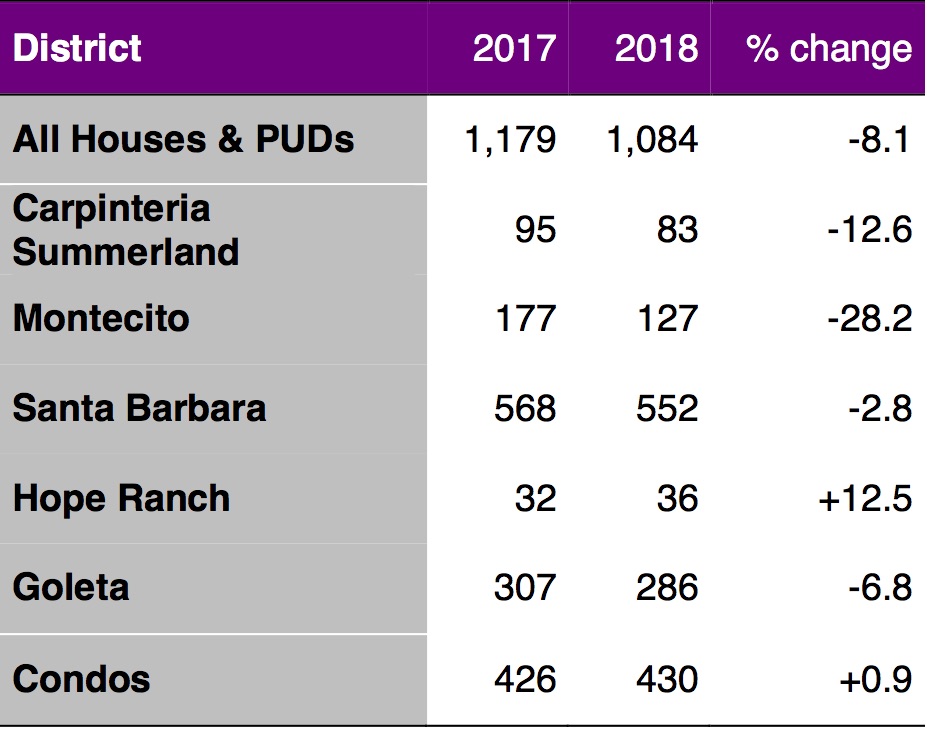
Table 2: Number of sales by district
2019 Forecast
Taking into consideration the above analysis, if we consider the impact in Montecito, the market in 2018 was relatively stable with small increases in prices and slight decreases in number of sales. The prediction for 2019: stability – in both prices and number of sales.
National and global issues can affect our local market, but the economy is strong; mortgage interest rates, although predicted to rise somewhat, are still historically low. The outlook for Santa Barbara looks good. And as we’ve seen over the past year, no matter what the coming year brings, our community knows how to come together to weather a storm.
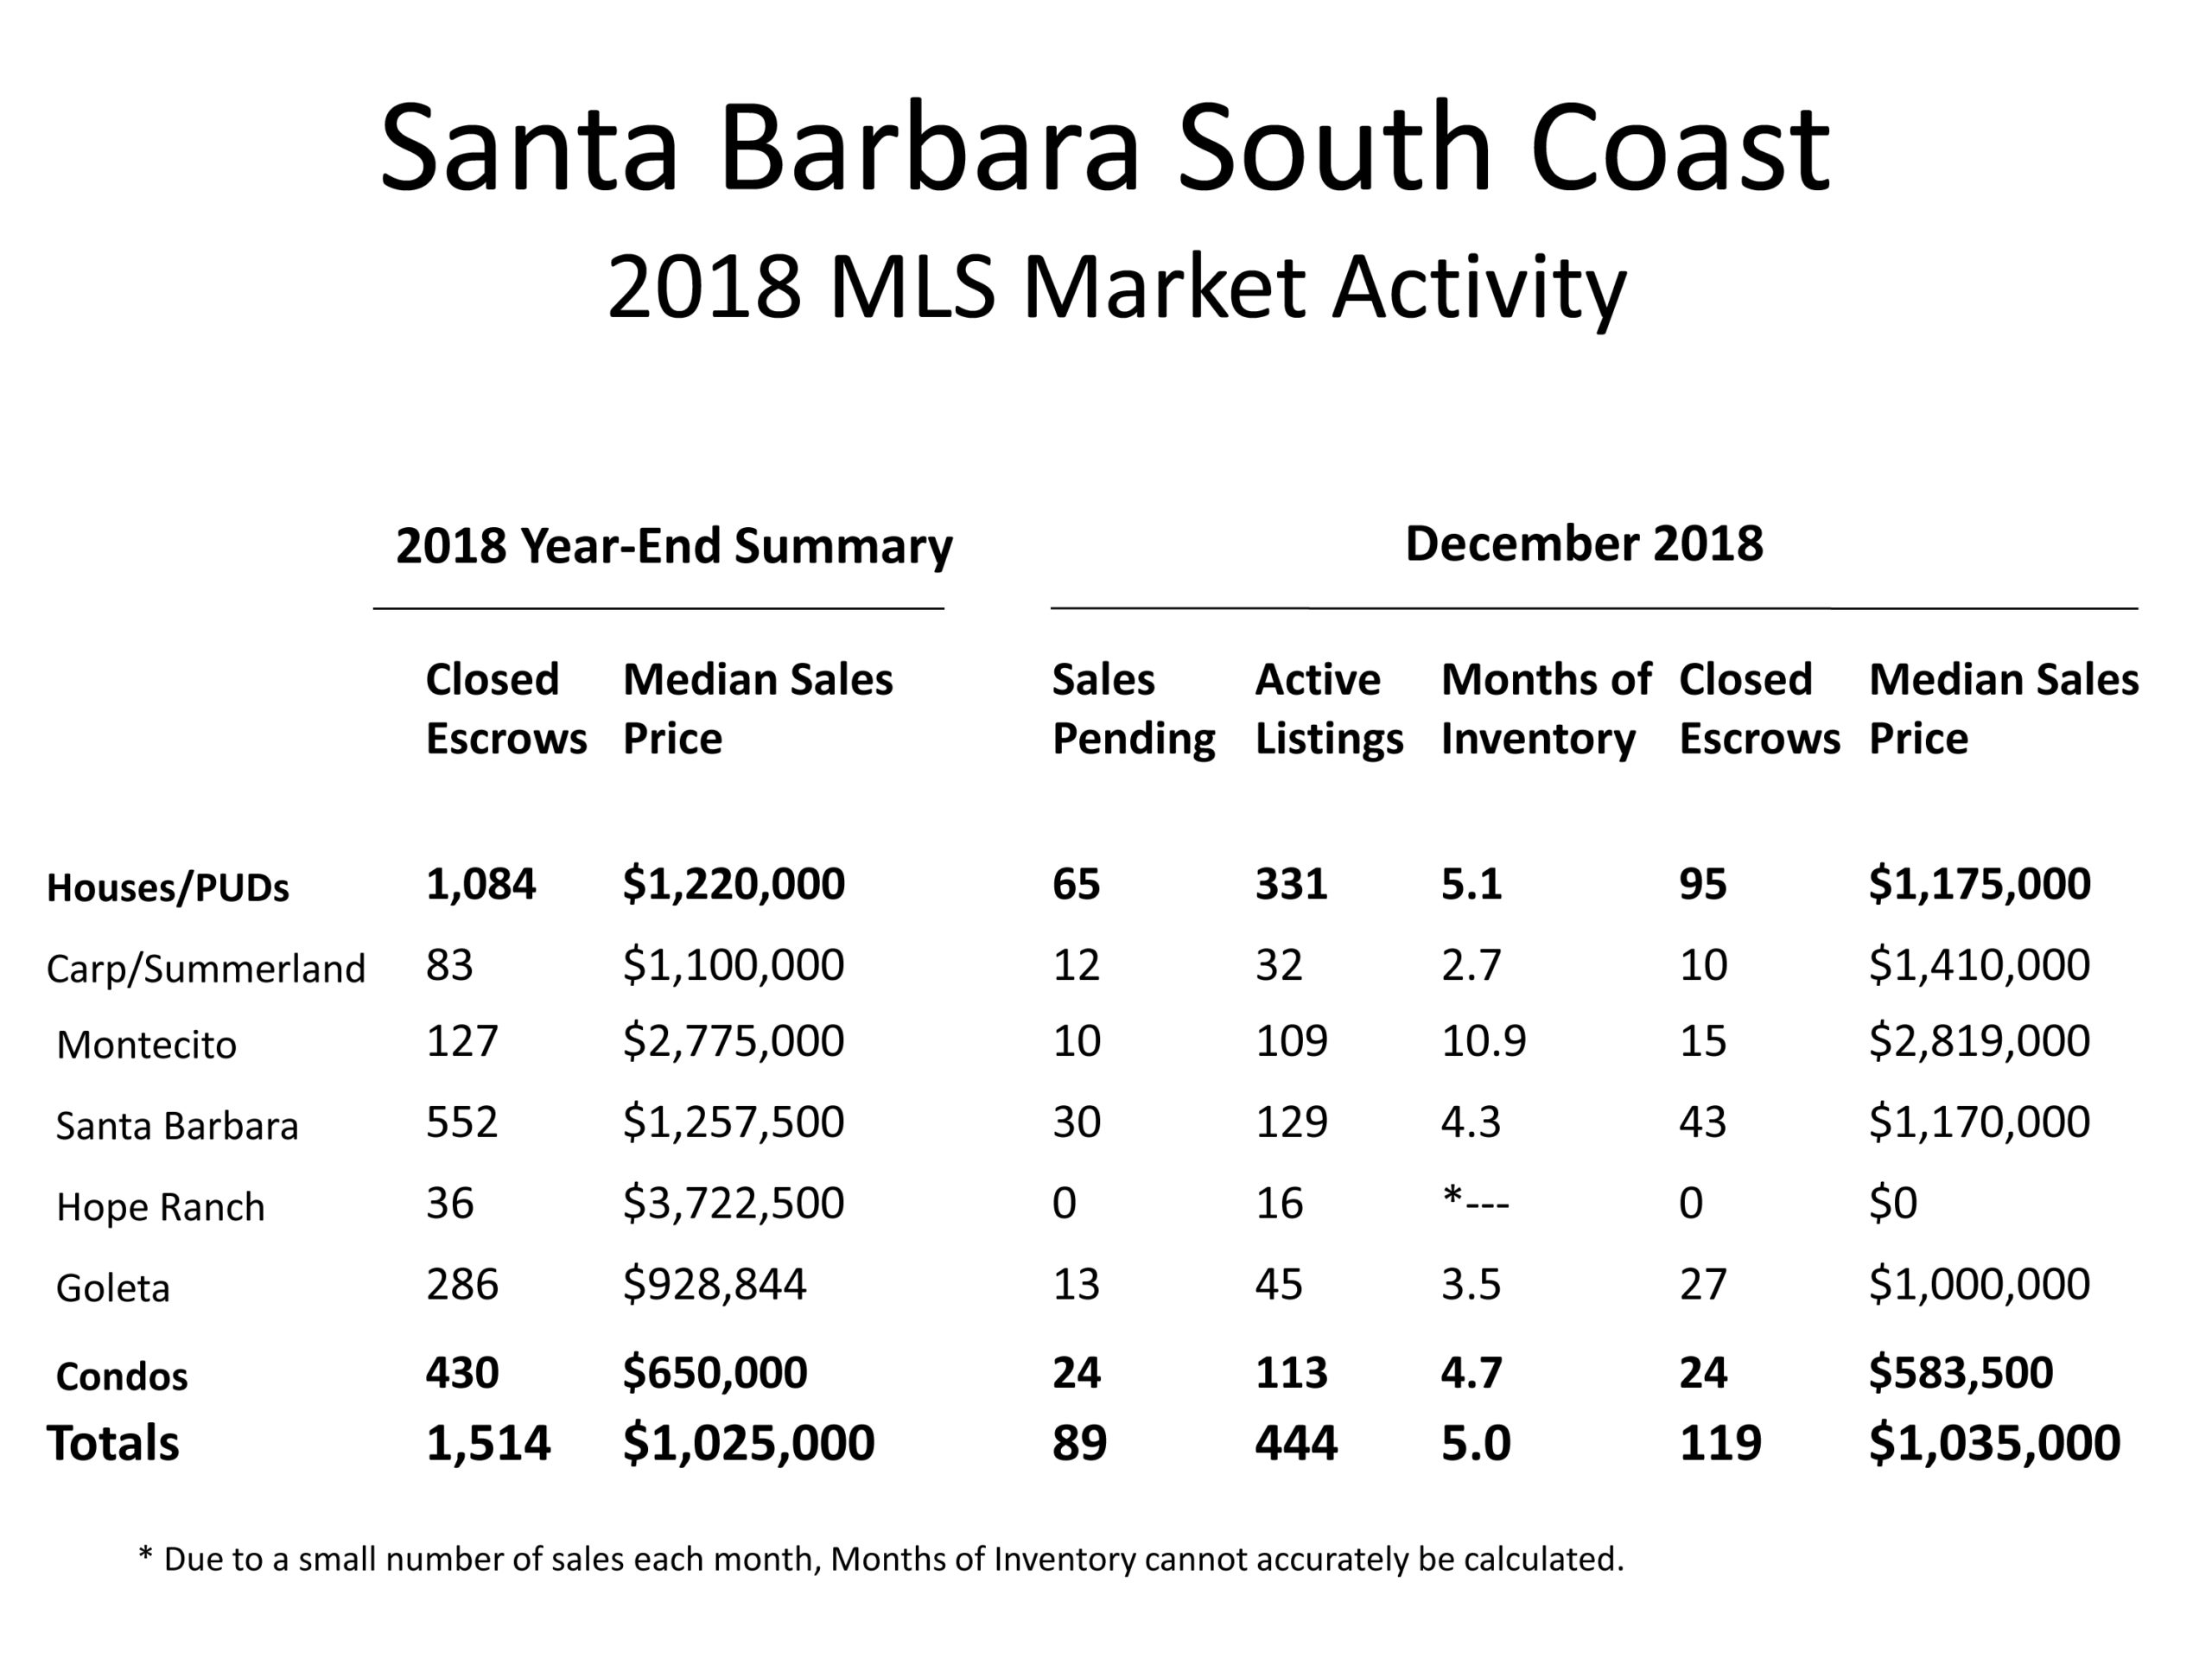
Table 3: MLS Market Activity