Third Quarter 2019 Statistical Analysis
Third-Quarter 2019 South Coast Santa Barbara Real Estate Market Update
Santa Barbara Association of Realtors, by Kalia J. Rork
It’s fall and change is in the air. Many news articles, and certainly real estate industry publications, predict that the real estate market is changing, too. “Get ready for a changing market!” is a common headline. But is our local real estate market changing? What have prices done this year? As reluctant as I am to contradict the exclamatory headlines, the statistics show that our local real estate market is pretty darn stable. Let’s look at the numbers.
The three primary statistics we record at the Santa Barbara Association of Realtors to track changes in the market are: the velocity of inventory (that is, how quickly are homes selling), the number of sales, and the median sales price. (See Table 1.)
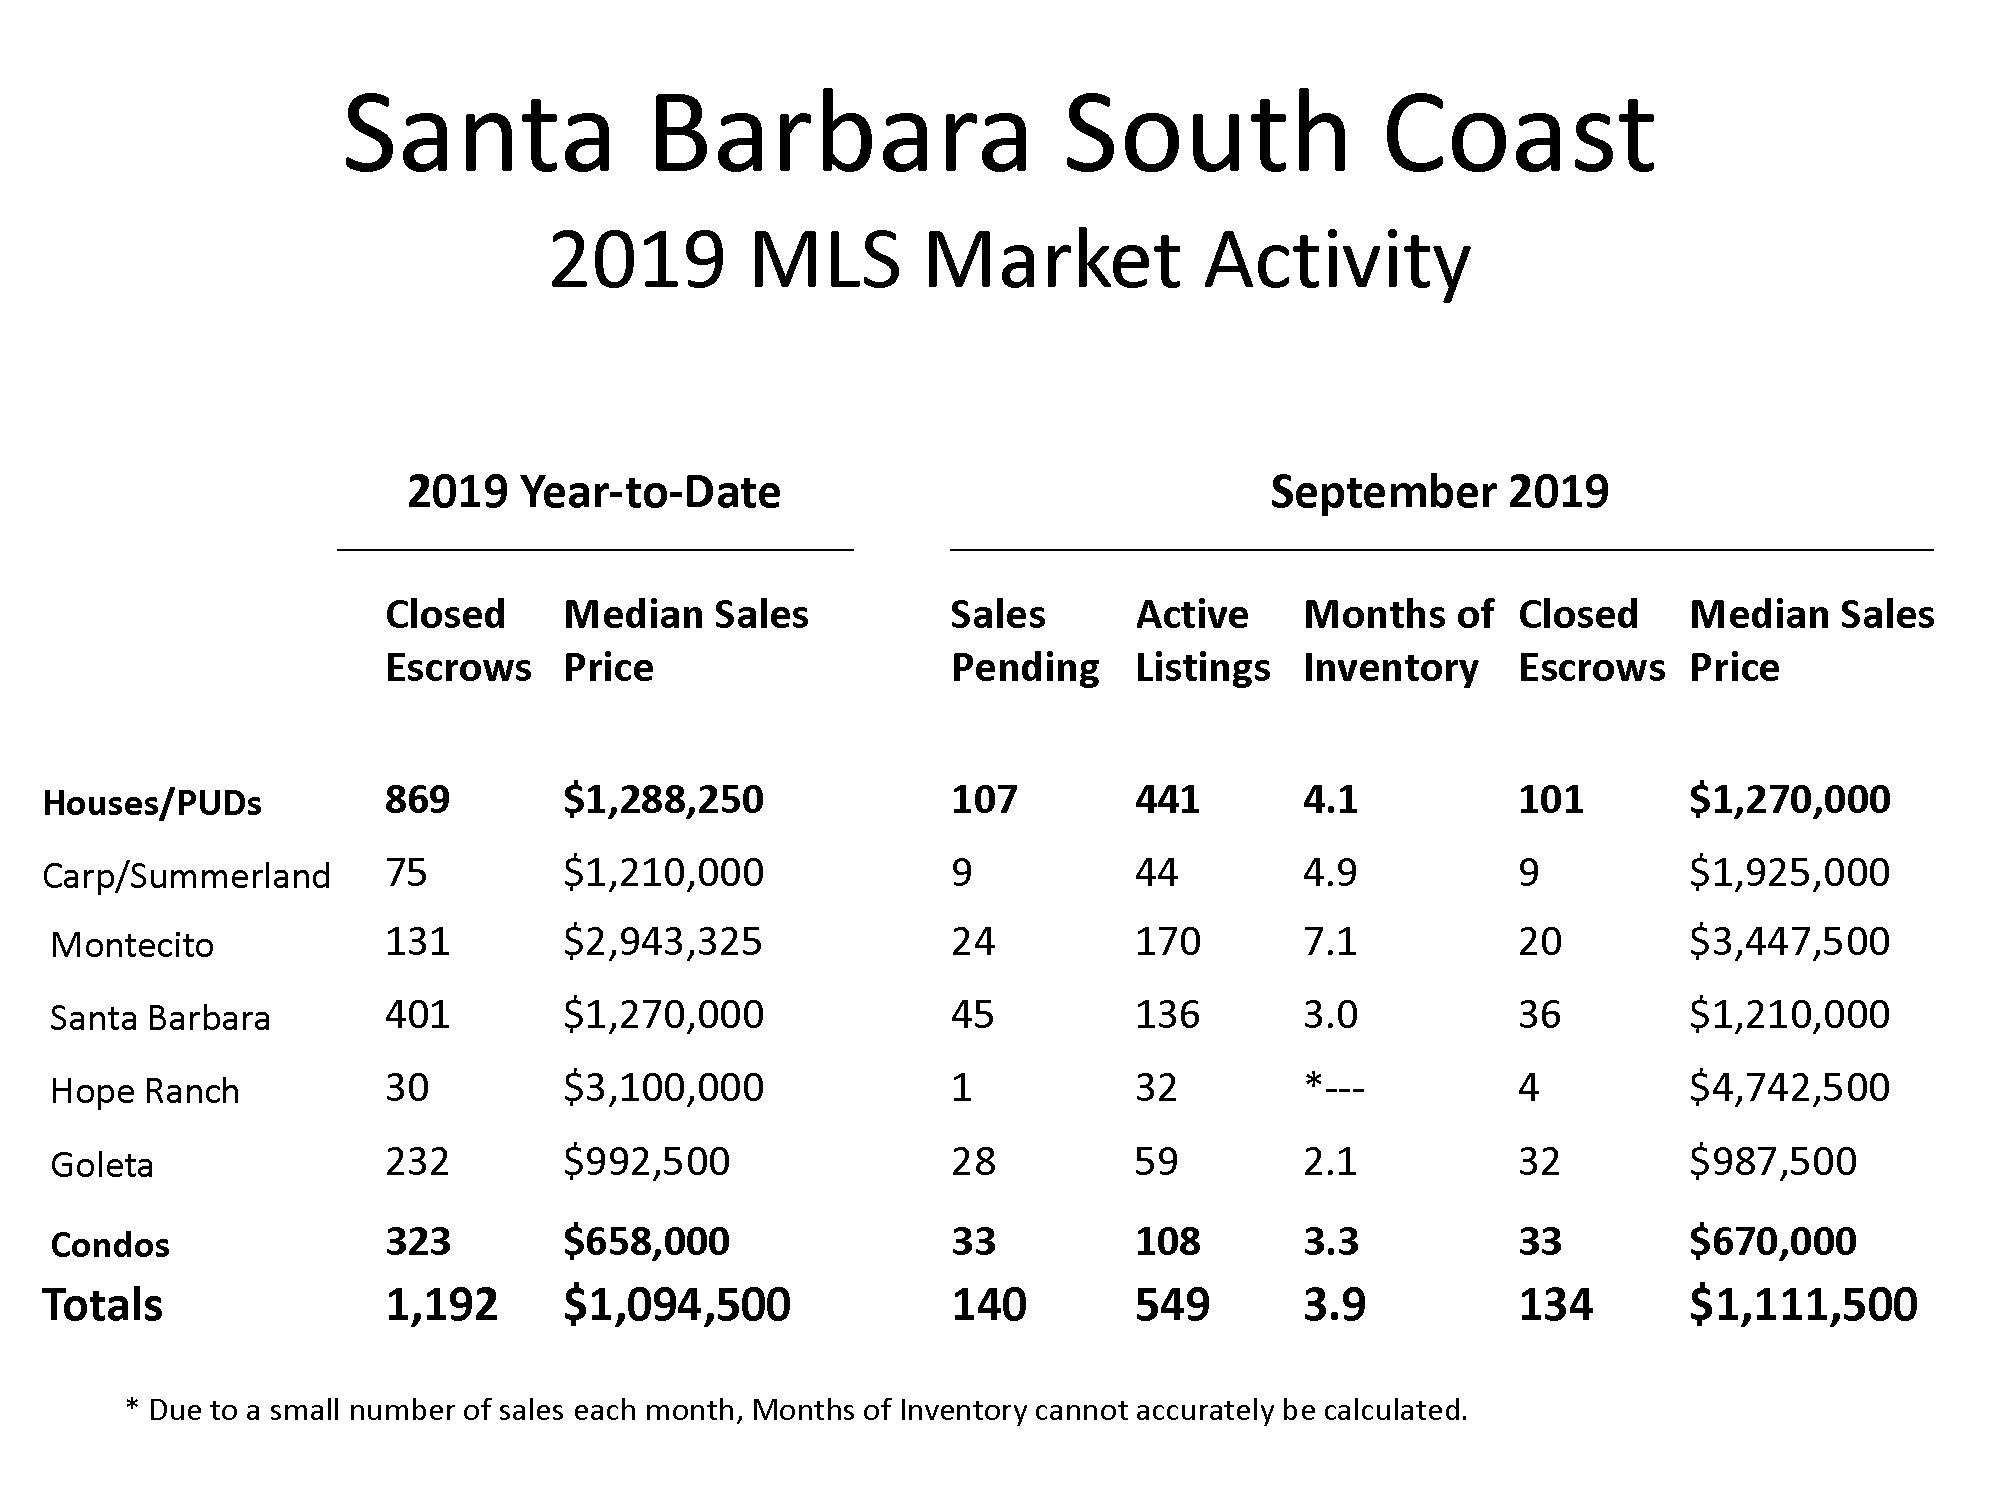
Table 1: September and year to date 2019
Lack of Homes for Sale
If you’re a home buyer, you no doubt have noticed the lack of inventory of homes for sale. Overall, the Santa Barbara south coast has just 3.9 months of inventory of houses and condos for sale, which means that, at the current pace of sales, all homes would be bought up in under 4 months if no new homes came on the market. This is hovering in sellers’-market territory. If inventory goes up past 6 months, we head into a market that favors buyers because there are more homes to choose from. At the beginning of 2019 we had a balanced market of 5 months of inventory, favoring neither buyers nor sellers. During this summer, buyers had fewer homes to choose from with inventory levels of 3 and 3.5 months. We’ve been on the edge between a buyer’s market and balanced market for most of the year, which is similar to last year. I do predict that this aspect of the market will change. We expect to see a little more inventory in 2020, and forecast a market that doesn’t strongly favor buyers or sellers next year.
Number of Sales
Now let’s look at the number of home sales (also shown in Table 1). This year to date: 1,192 closed escrows (houses and condos). Last year to date: 1,163 closings. That’s a mere 2.5% more homes sold this year so far than last year. In fact, for the last four years, Santa Barbara has had a consistent number of sales in our south coast region (Goleta to Carpinteria), differing only 5% during those years. We should see a slight slow down in sales during the last quarter of the year, which is a normal trend, but expect next year to see similar number of sales.
Prices [icon name=”area-chart” class=”” unprefixed_class=””]
Prices have been mostly steady this year, too, with slight increases. Our median sales price for houses and PUDs for all districts through September 2019 is $1,288,250. Last year at this time it was $1,249,000, so we have had an increase in median sales price year over year of 3.1%. For condos, year-to-date 2019 median sales price is $658,000 and one year ago this month it was $650,000, which is an increase of just 1.2%. Interestingly, the median sales price for condos stayed the same during the fourth quarter of last year, and the median price for houses dipped slightly during that same period. This is also a common trend for our local market: we tend to see most of our price increases during the first three quarters. Expect to see the median prices stay roughly the same as they are now through the end of the year.
Neighborhood differences
We also keep track of prices and inventory by local district. In the table, you’ll see rows for each of our major areas, Carpinteria/Summerland, Montecito, Santa Barbara, Hope Ranch, and Goleta. We also tabulate stats separately for condos (in all districts combined). Hope Ranch has seen an increase in active listings since last fall, with 32 active listings compared to 24 this time last year. Hope Ranch has had yearly sales of between 20 and 36 for the past 15 years, so the total sales year to date of 30 is a respectable number. Even though inventory in the Ranch is high, sales are robust. (Note that because Hope Ranch is such a small area, the months-of-inventory number is not statistically valid.)
Montecito
As we noted in the last installment of this article, sales in Montecito have rebounded. The total sales through the third quarter stand at 131, compared to last year’s 92 sales at this time of year. Over the past four years (coinciding with fairly stable selling prices), we’ve seen 173–177 sales per year in Montecito (with the exception of 2018), and we are on track to end up with about 174 sales this year. Prices in Montecito are up from last year’s third quarter, as expected. Median price stands at $2,943,325 as of September 2019, up 3.7%. Looking back two years, before the debris flow, median selling price in Montecito was almost the same as it is now, at $2,949.500. It speaks to the resiliency of our community and the desirability of our area for Montecito to have rebounded this quickly after the tragic events of January 2018.
Carpinteria
Looking at our other districts, Carpinteria’s median sales price is up 13.2% over last year. But wait! Before we conclude that is due to price appreciation, let’s look closer. Median price reflects both price appreciation as well as the mix of homes sold. If many more homes sold at the high end than is customary, that will bring up the median price. And Carpinteria this year is a perfect example of this. We’ve had nine sales so far in 2019 that sold for over $5,000,000. In 2018, there were nosales in Carpinteria over $5 million. This definitely brought up the median selling price. Eight of these nine sales were beach front homes, by the way, with the highest fetching over $24 million.
Santa Barbara
Prices in Santa Barbara proper (East and West of State Street) are down slightly, with this year’s median at $1,270,000 compared to last year $1,277,500. That’s just 0.6% and not much of a change. Nearly half of our total sales occur in Santa Barbara (with the rest distributed among Hope Ranch, Montectio, Carpinteria, and Goleta), so looking at this district is a good gauge of the market — and it looks steady.
Goleta
Goleta prices are up 7.2% year over year. And the number of sales is up almost 9%. The median Goleta house selling price is now just under $1 million, at $992,500 (which is a record high). Some of this appreciation is due to more high-priced homes selling than the year before, but not as much as Carpinteria. This year there have been 20 sales in Goleta over $2 million, compared to only 11 the year before. Six of this year’s high-priced Goleta sales were new construction in the foothills. Goleta Valley still has the lowest inventory of all our neighborhoods, with just 2.1 months at the end of September.
Summary
What’s the take away from our review of the numbers? We are seeing some changes: more higher priced homes are selling, for example, and that’s increasing the median selling price in some areas. And we’re seeing quite a bit of stability with only slight increases or decreases in inventory, in number of sales, and in prices over the past two years in most districts. This is humdrum news and probably not worthy of big splashy headlines. However, in this somewhat-balanced-and-not-so-dramatic real estate climate, there are opportunities to be found for bothbuyers and sellers – and that in itself is newsworthy!
This article originally appeared in the Santa Barbara News-Press.
Kalia Rork is a licensed Realtor with Berkshire Hathaway HomeServices California Properties and can be reached at 805-689-0614, kalia@liveinsb.com, and www.liveinsb.com. DRE lic# 01313668